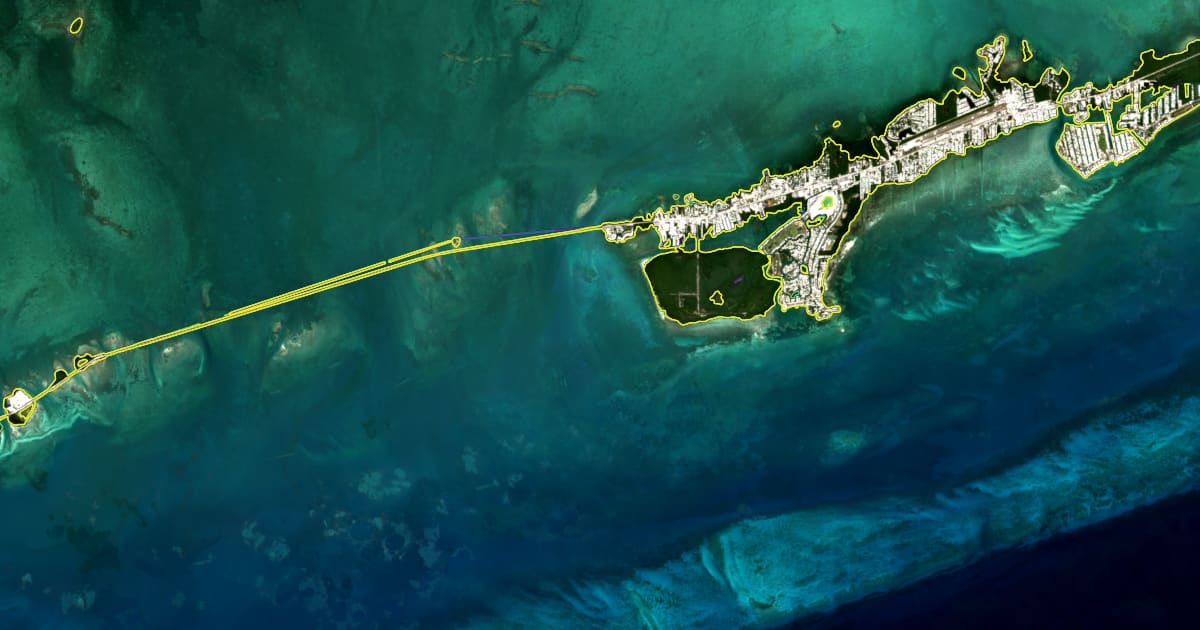
Everyone who keeps a boat in Marathon has an opinion about which beach is going and which bar is growing. We asked the satellites. For the 0.25° square around Marathon (Vaca Key, Boot Key, Grassy Key, the Seven Mile Bridge approaches; 24.50 to 24.75 N, 81.25 to 81.00 W) we drew the shoreline for every year from 2017 to 2026 from the eight clearest pictures of each year, then measured how far it moved along 1,682 lines spaced 50 m apart. The full map, with every year and every line, is the Florida Keys shoreline demo.
The short answer
Over ten years the Middle Keys coast is remarkably steady. Along two thirds of the measuring lines (66 %) the shoreline moved by less than half a metre a year, which is within what the method can tell apart from noise. A quarter of the lines (24 %) show the shore advancing, mostly where mangroves fill in and where sand collects on the lee of causeways and canals. One line in ten (10 %) shows retreat. The median rate across the whole square is +0.1 m a year, in other words: no net loss.
| Share of the coast | |
|---|---|
| Stable (within ±0.5 m a year) | 66 % |
| Advancing (more than +0.5 m a year) | 24 % |
| Retreating (more than −0.5 m a year) | 10 % |
The total shoreline length we traced fell from about 119 km in 2017 to about 112 km in 2026. That is not land disappearing: small ponds and mangrove fringes that were open water in the early years have closed up, and a closed pond is a shorter line.
Where it moves most
The strongest retreat in the square is on the ocean side of the eastern keys near 24.725 N, 81.015 W, where the line moved landward about 147 m over the record, close to 16 m a year. The second is on the Atlantic shore of Vaca Key near 24.703 N, 81.112 W, about 124 m or 14 m a year. Both are low, exposed stretches where a single storm season can rearrange the beach, and both should be read as “watch this” rather than as a straight-line forecast: a rate measured over ten years on a beach that jumps back and forth after storms carries a wide error bar.
On the other side of the ledger, the fastest-growing spot is near 24.718 N, 81.091 W, where the shore moved about 100 m seaward, close to 13 m a year, where sand and mangrove have filled a sheltered pocket.
The demo page lists the ten strongest retreat points with a button that flies the map to each one. Tap any coloured dot on the map to read the rate for that line.
How to read the map
- Each coloured line is one year, from purple (2017) to yellow (2026). Where the lines sit on top of each other the coast has not moved; where they fan out, it has.
- The dots along the coast are the measuring lines. Red and orange dots are retreating, grey are stable, light and dark blue are advancing.
- Rates are averages over the whole record. A rate inside ±0.8 m a year is within the noise of the method and should be read as “stable”.
- The lines follow the waterline on the day of the pictures. The tide is not removed, so very flat shores (the bayside flats at low water) look noisier than steep ones.
- Harbours, seawalls and beach fills show up as real change, because they are.
Why this matters for the water you paddle
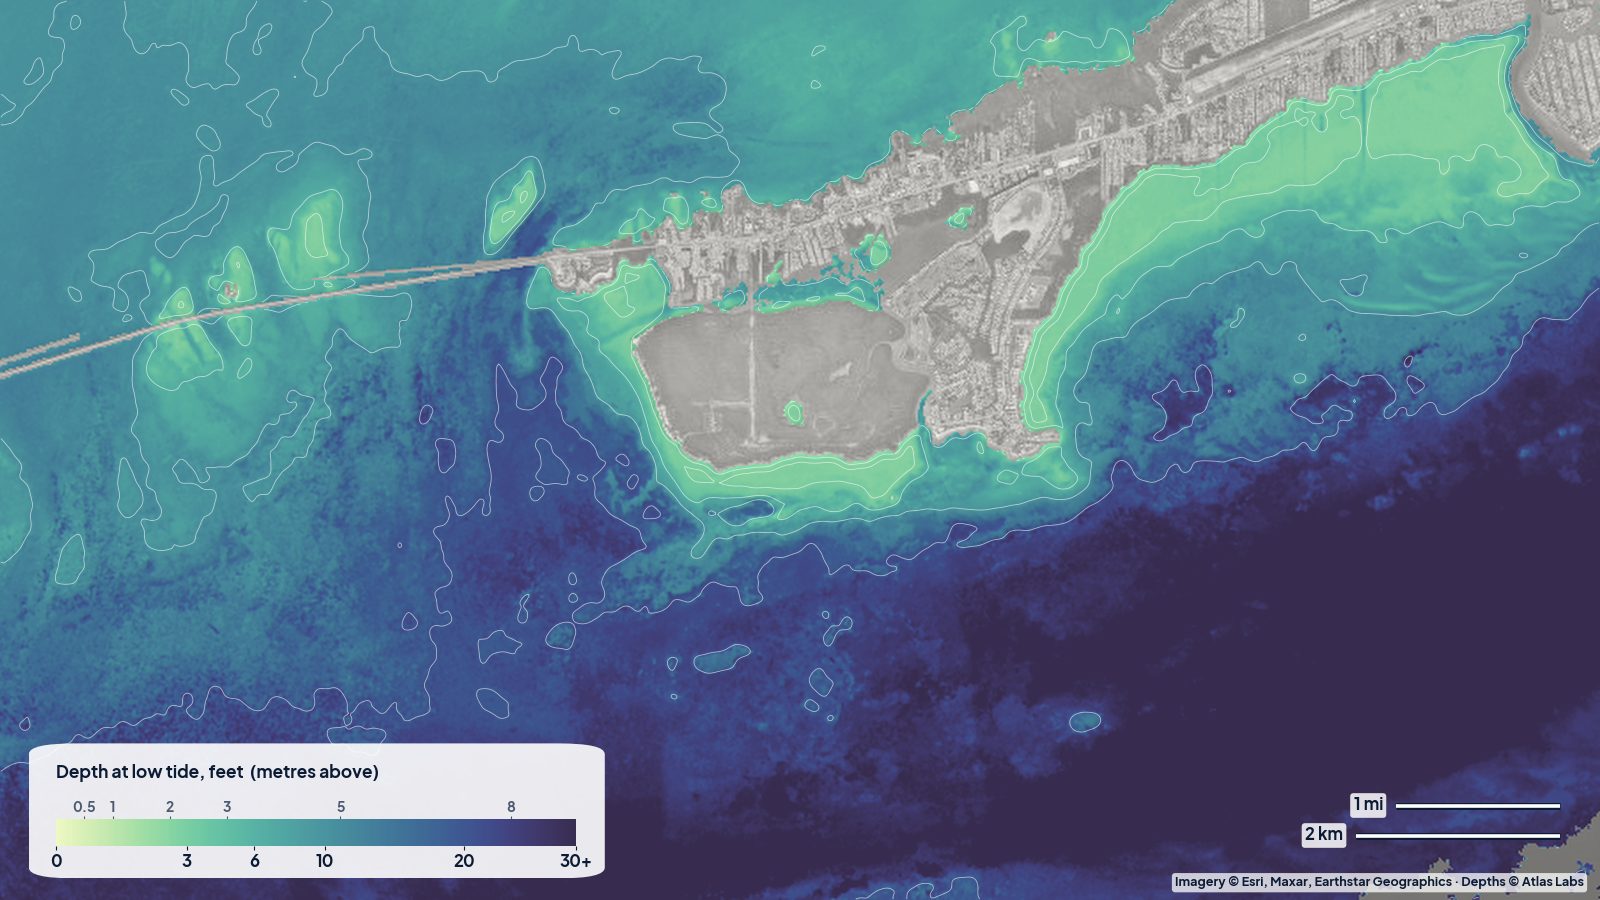
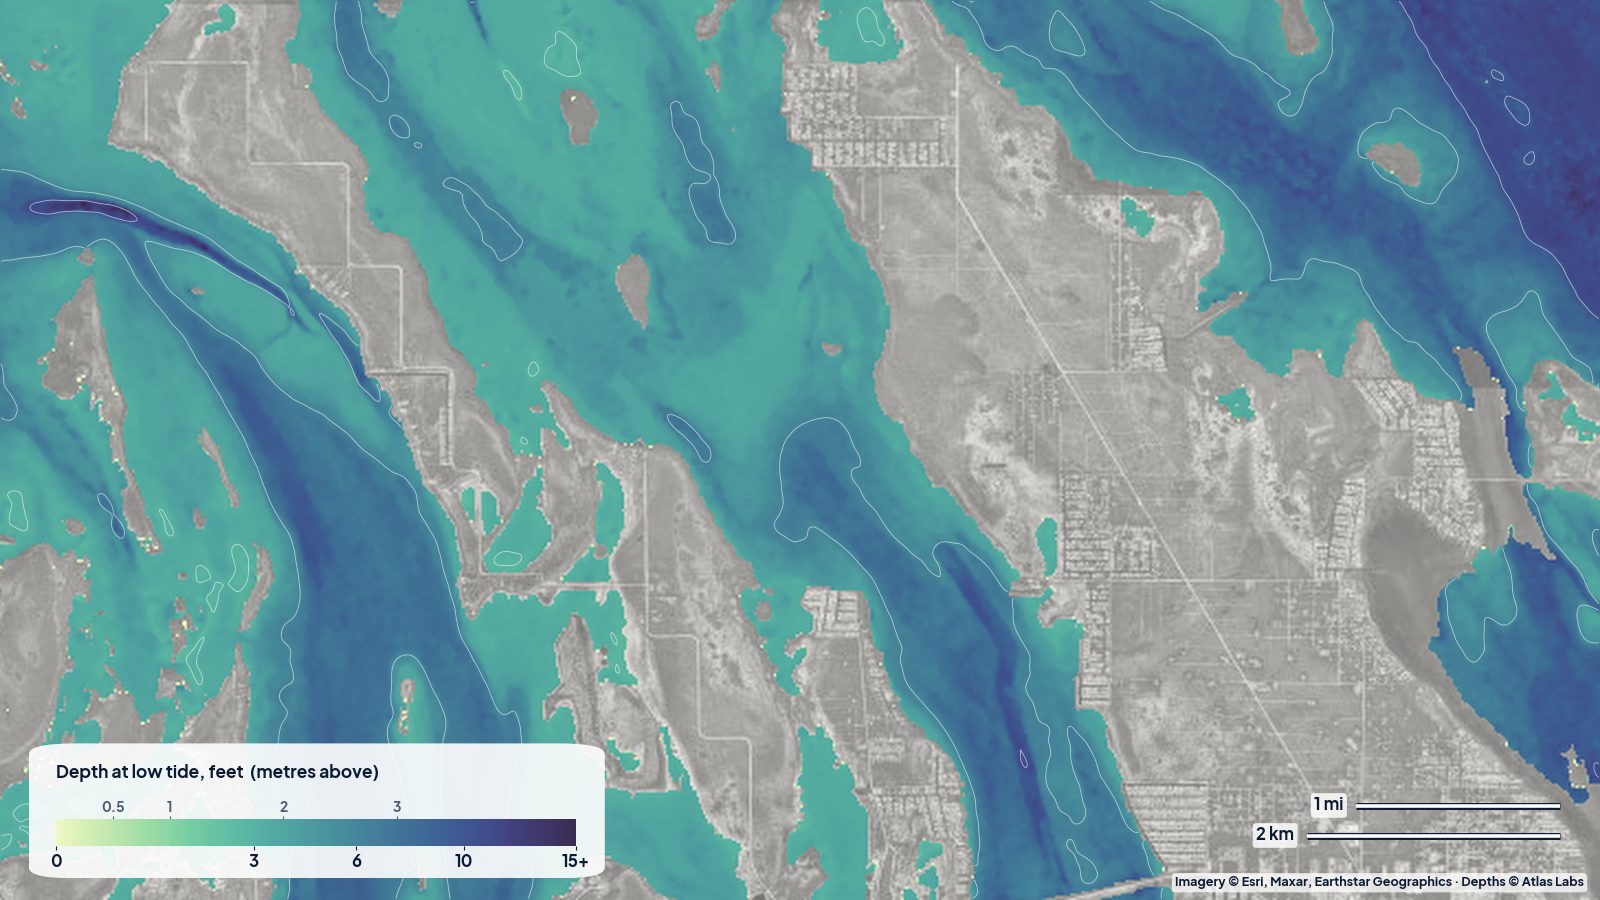
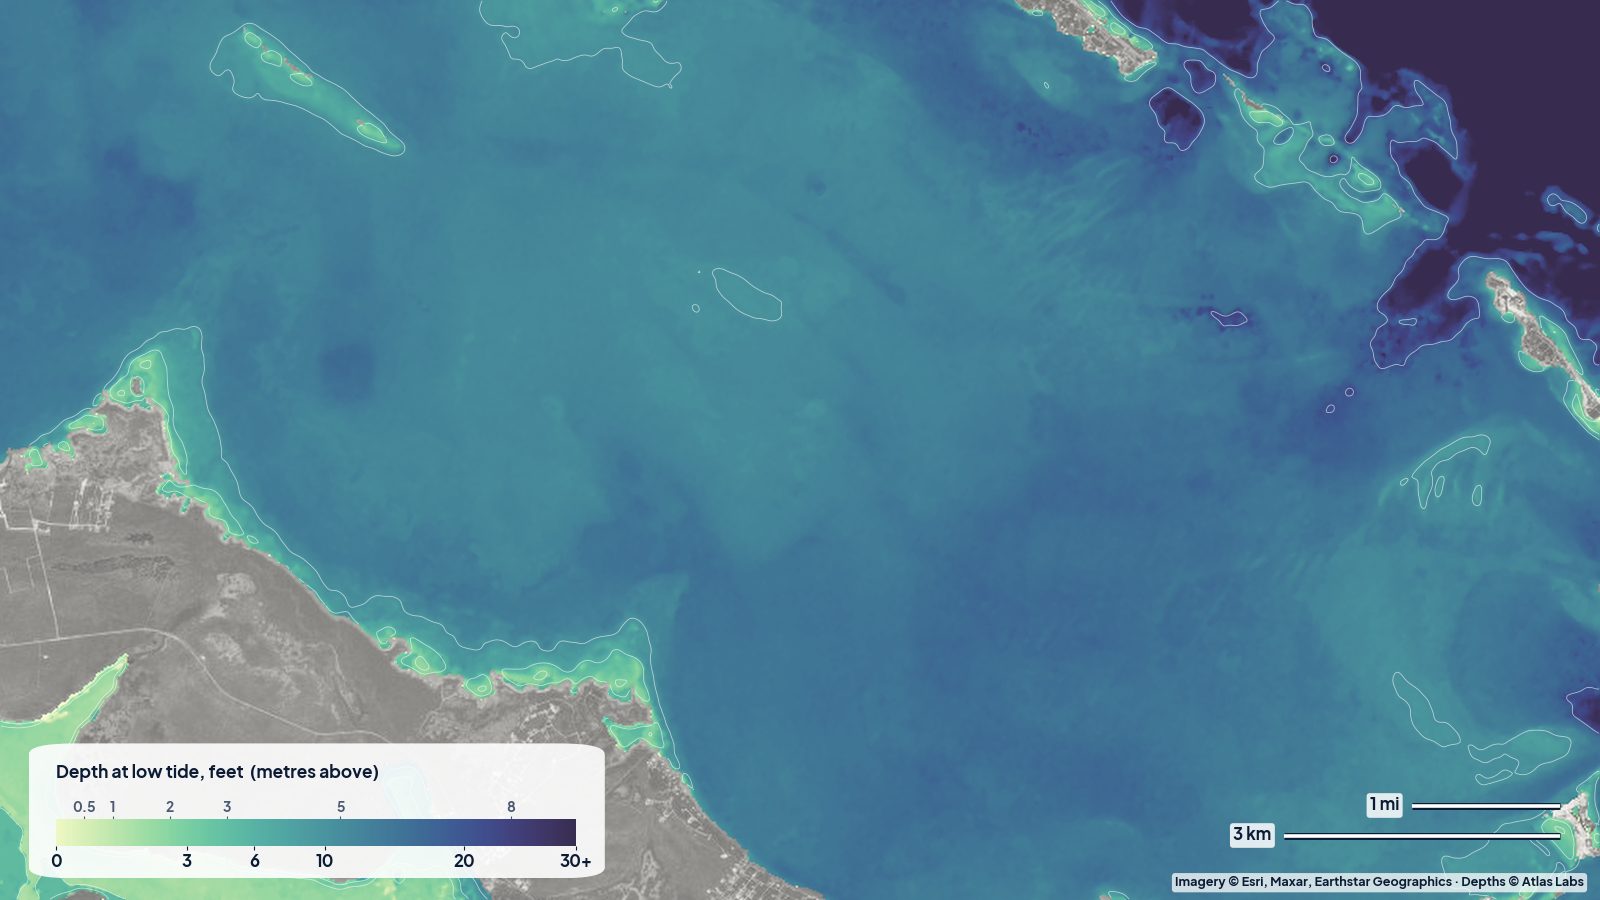
Shoreline change and water depth go together: where a beach grows, a bar is usually growing in front of it; where it retreats, the sand went somewhere, often into the channel you use. The Marathon depth map shows where that sand is today, and the shoreline demo shows which way it has been going.
Get one for your coast
The same map can be made for any coast on Earth, in squares of 0.25° (about 27 km on a side), with every year since 2017 and, on request, the long record in 5-year steps since 1985. It takes about ten minutes per area and costs $9 per area, free with a Business plan. Order a shoreline map.
Shoreline positions are satellite estimates; they do not replace a survey for legal boundaries.