Every ShoalScope map shows a “typical error” in feet. This post explains where that number comes from, what it means on the water, and how our first eight maps of Florida and the Bahamas scored. Short version: in clear water the typical error is 2 to 3 ft (0.6 to 1 m); in the greener water of the back bays it is 3 to 5 ft (1 to 1.5 m); and where the water is too murky to see the bottom from space, we do not publish a map at all.
How we check a map
A satellite picture tells you how much light comes back from the water, not how deep it is. To turn colour into depth you need real measurements, and to check the result you need more real measurements that were not used to make it.
Ours come from a laser on a NASA satellite that fires green light at the sea and times the echo from the sea floor. It flies narrow tracks across the coast, so it measures depth precisely along lines, but not everywhere. We correct those soundings to the same tide level used on US charts (mean lower low water), then split them by place: some areas train the model, other areas are kept aside. The map is scored only on the soundings it never saw, at places it never saw. That is the honest test: it is how the map behaves where you have no sounding to compare with.
The score is the root-mean-square error. Roughly two out of three points on the map are within that distance of the true depth, and almost all are within twice that.
The results
| Area | Typical error | Independent checks |
|---|---|---|
| Sea of Abaco and Marsh Harbour, Bahamas | 2.0 ft (0.60 m) | 3,268 |
| Santa Rosa Sound to Destin, Panhandle | 2.0 ft (0.61 m) | 199 |
| Marathon and Seven Mile Bridge, Keys | 2.9 ft (0.87 m) | 5,831 |
| Biscayne Bay, Stiltsville and Elliott Key | 3.2 ft (0.98 m) | 423 |
| Florida Bay and Flamingo | 3.4 ft (1.04 m) | 365 |
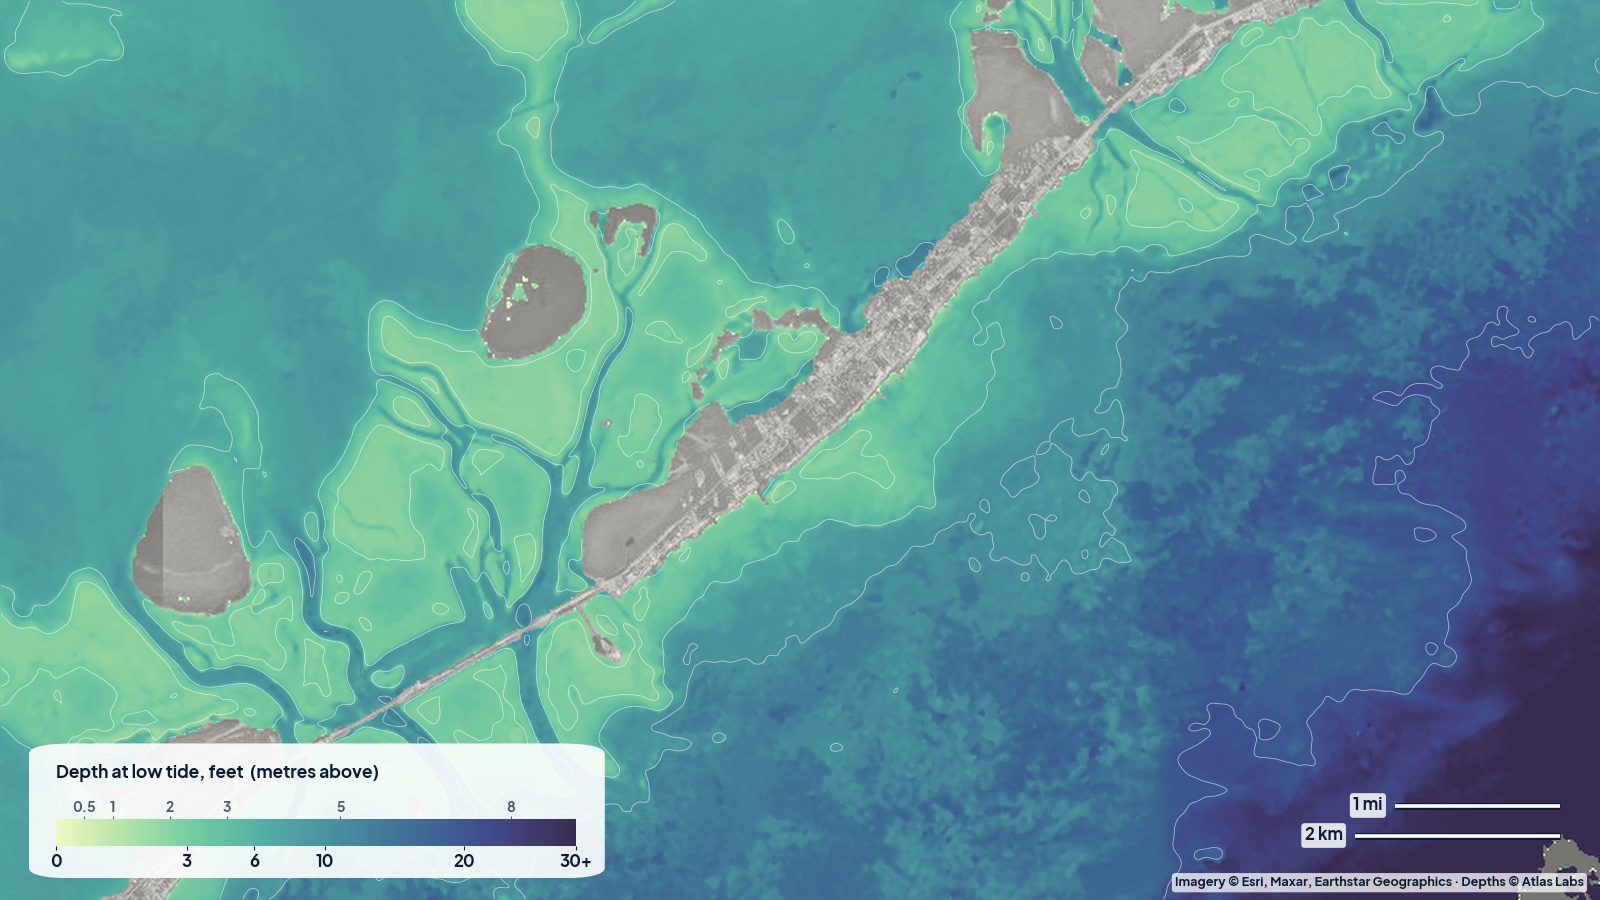
| Islamorada and the Upper Keys backcountry | 3.8 ft (1.16 m) | 1,795 |
| Pine Island Sound and Captiva | 4.6 ft (1.41 m) | 94 |
| Bahia Honda and Big Pine Key | 4.9 ft (1.50 m) | 1,496 |
The Abacos and the Panhandle are the best for the same reason: clear water over white sand, where the colour changes smoothly and strongly with depth. The Keys and Biscayne Bay are good on the sand and slightly worse over dense turtle grass, which is dark at any depth. Florida Bay and Pine Island Sound carry more fine mud and tannin from the Everglades and the Caloosahatchee, which blurs the signal.
What a good map and a fair map look like
Numbers in a table are abstract, so here are two of the real maps the best scorer, one of the harder ones, and one in between.
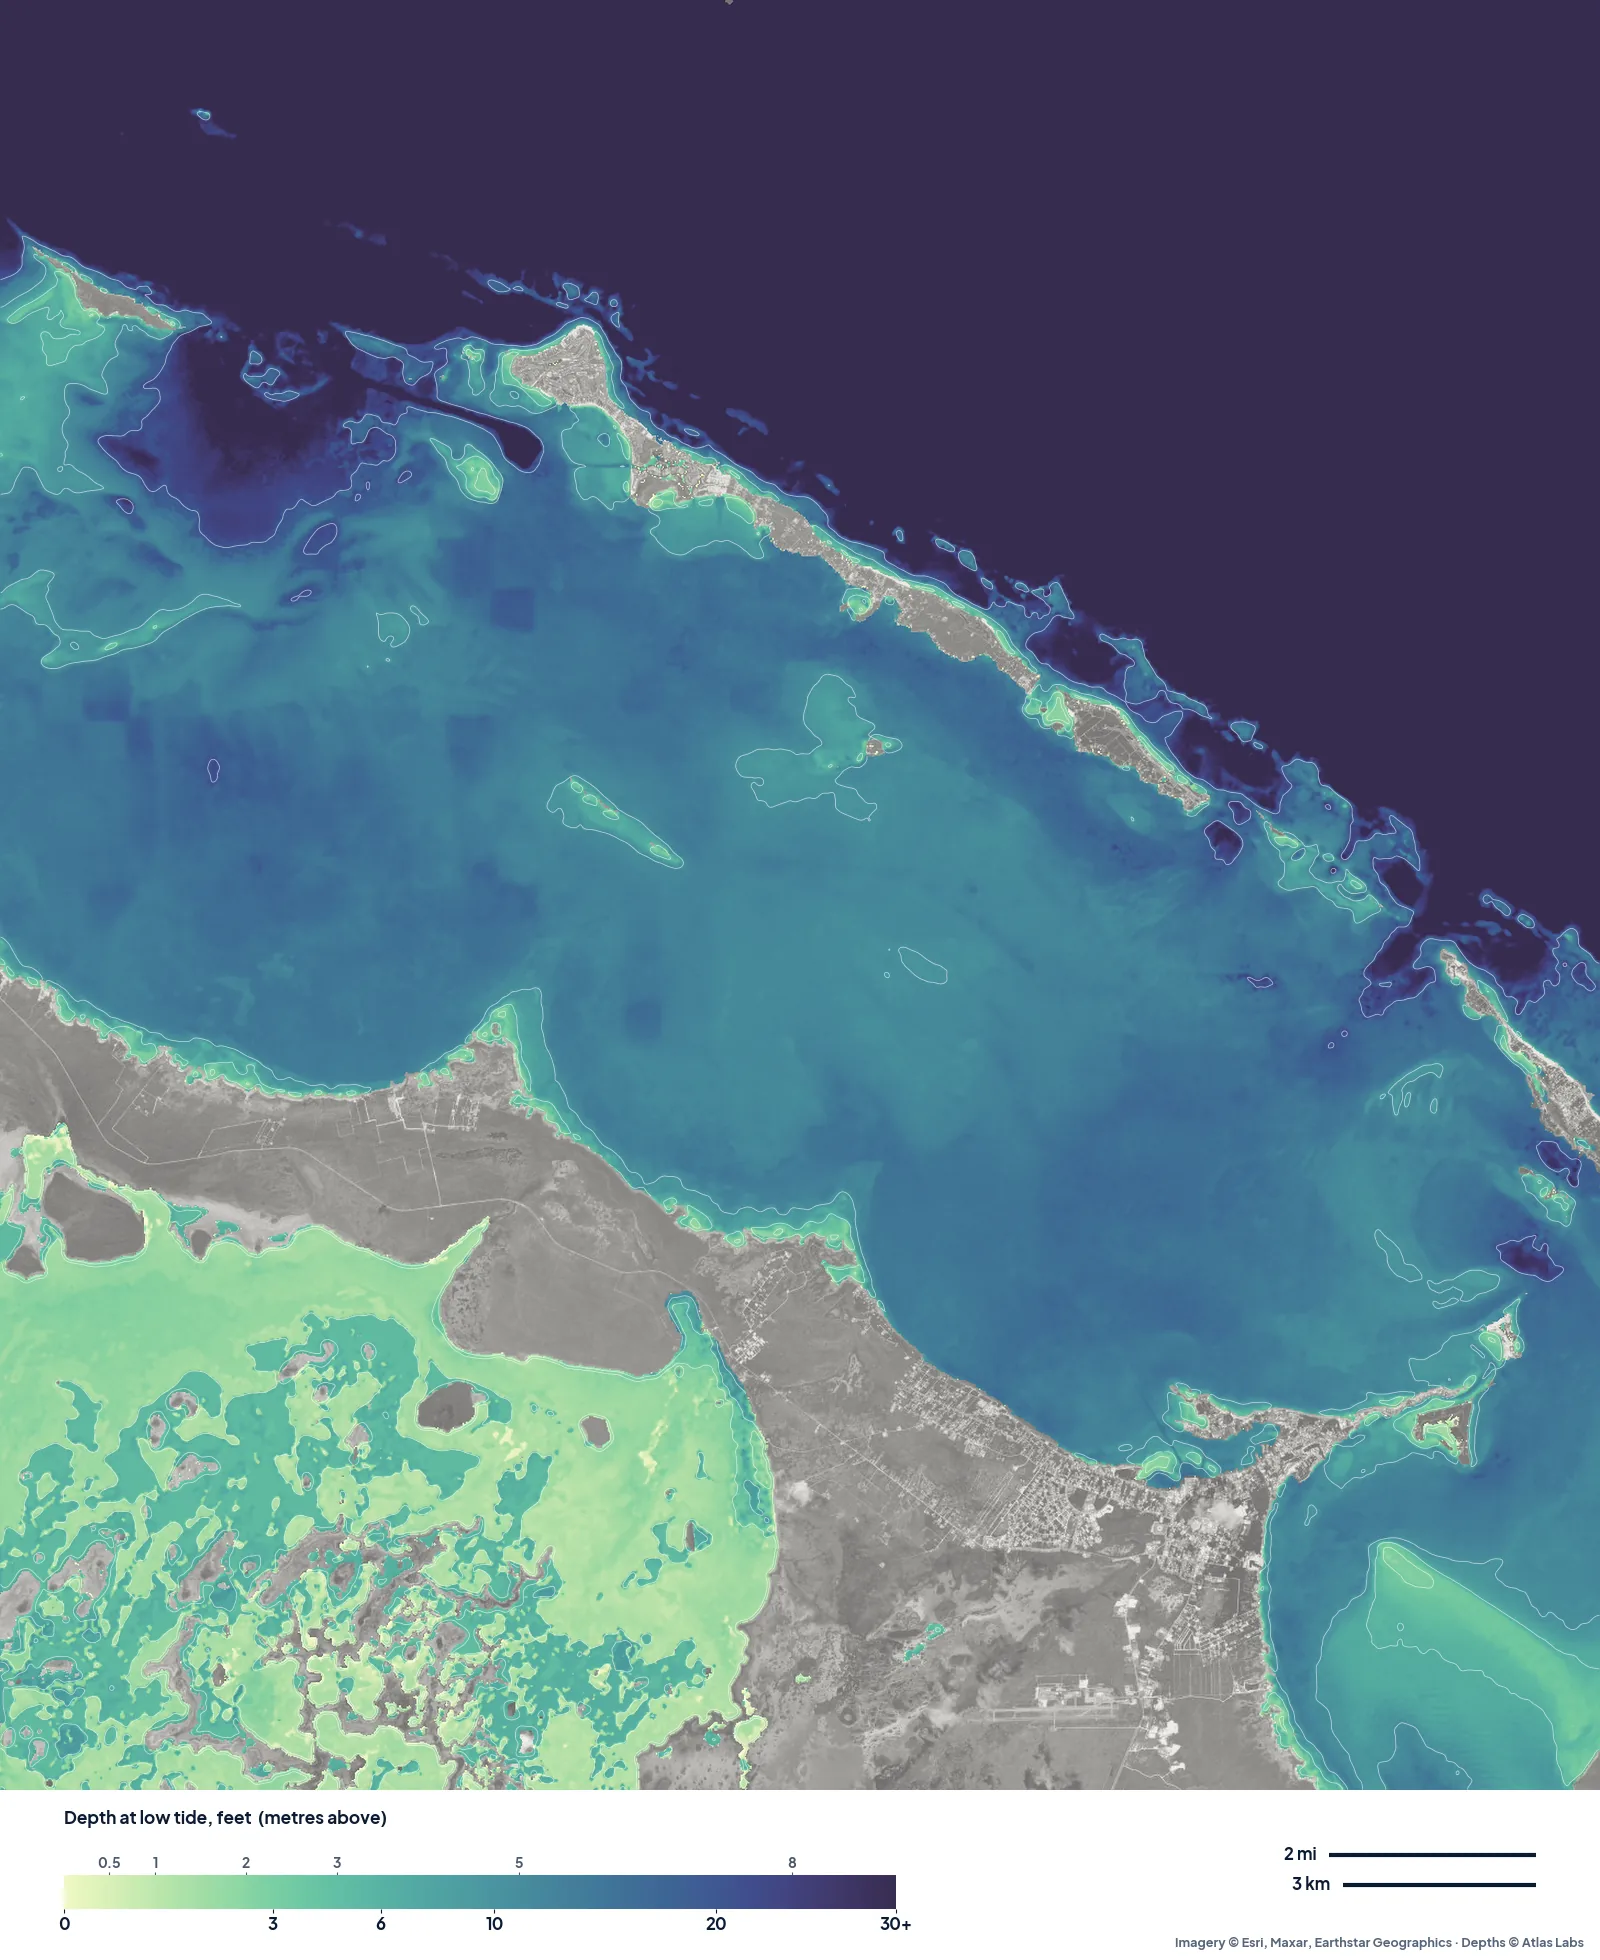
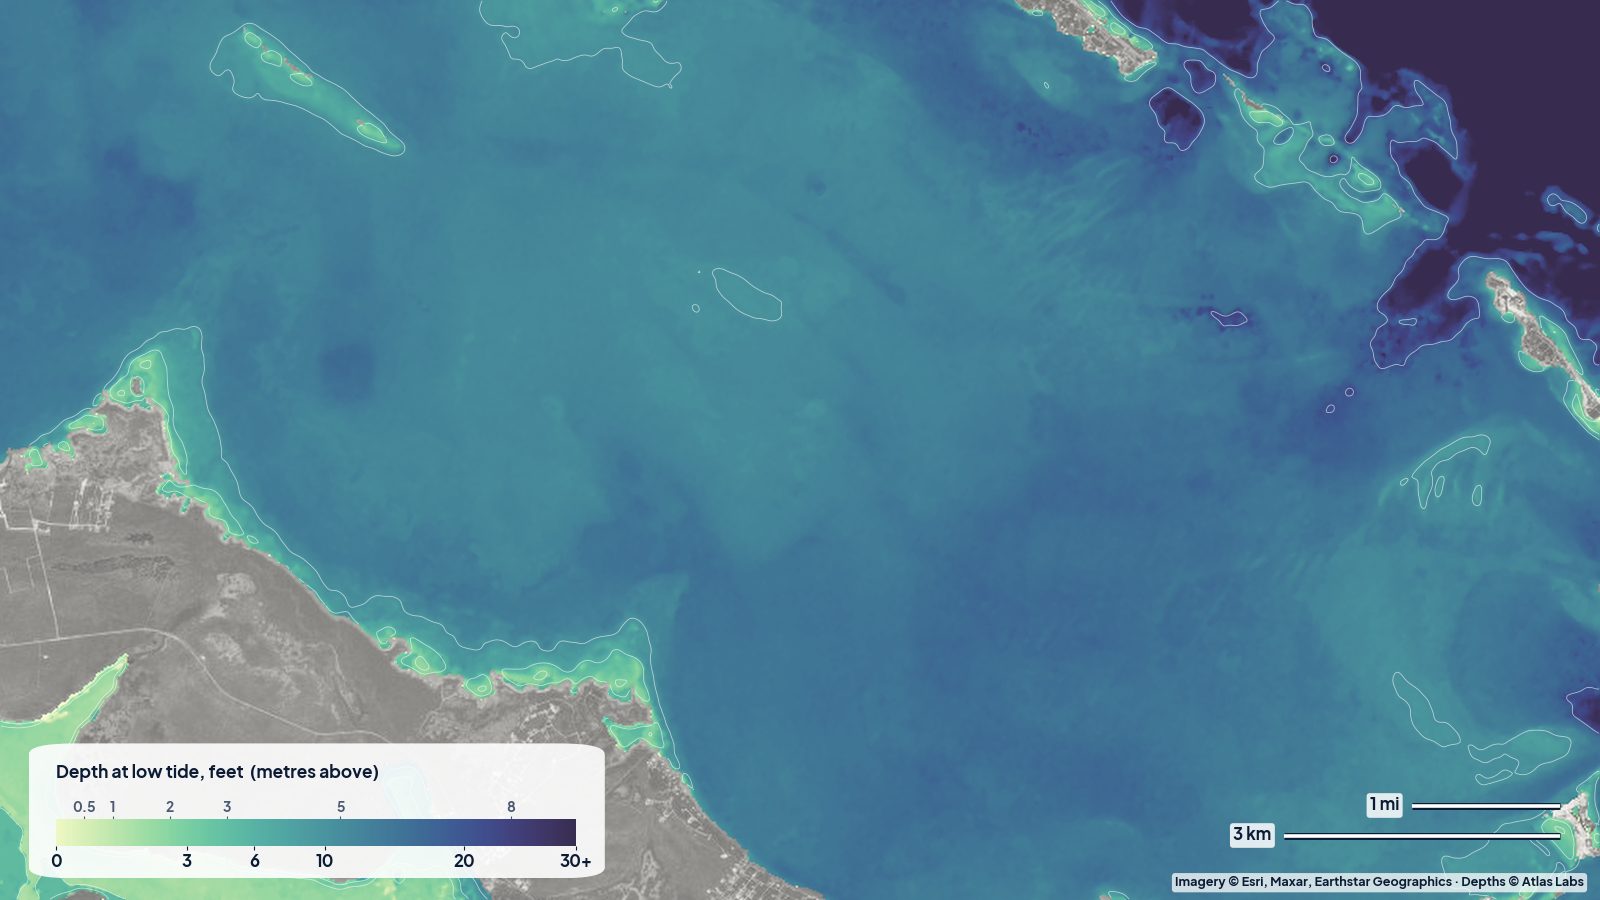
The Sea of Abaco, typical error 2.0 ft (0.60 m). Clear water over white sand gives smooth, believable colour steps: the pale margin along the mainland, the 10 to 20 ft body of the sea, and the cuts out to the ocean.
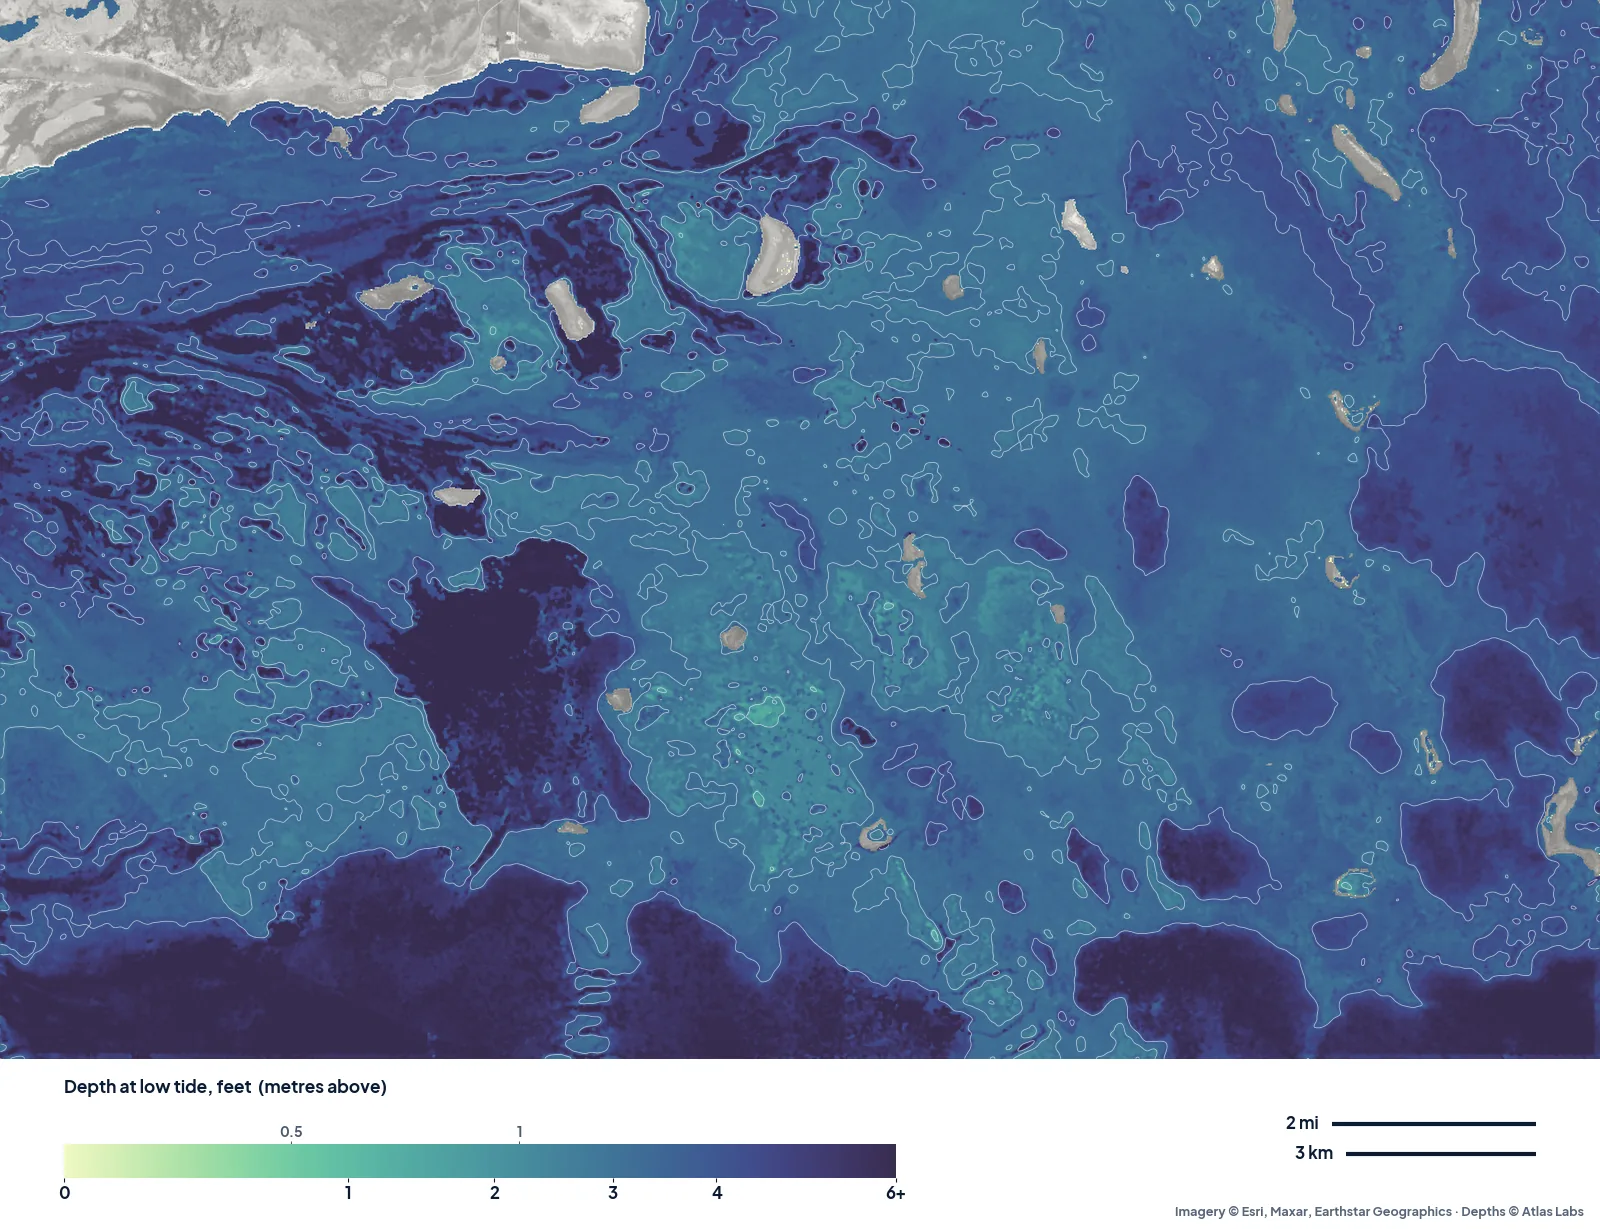
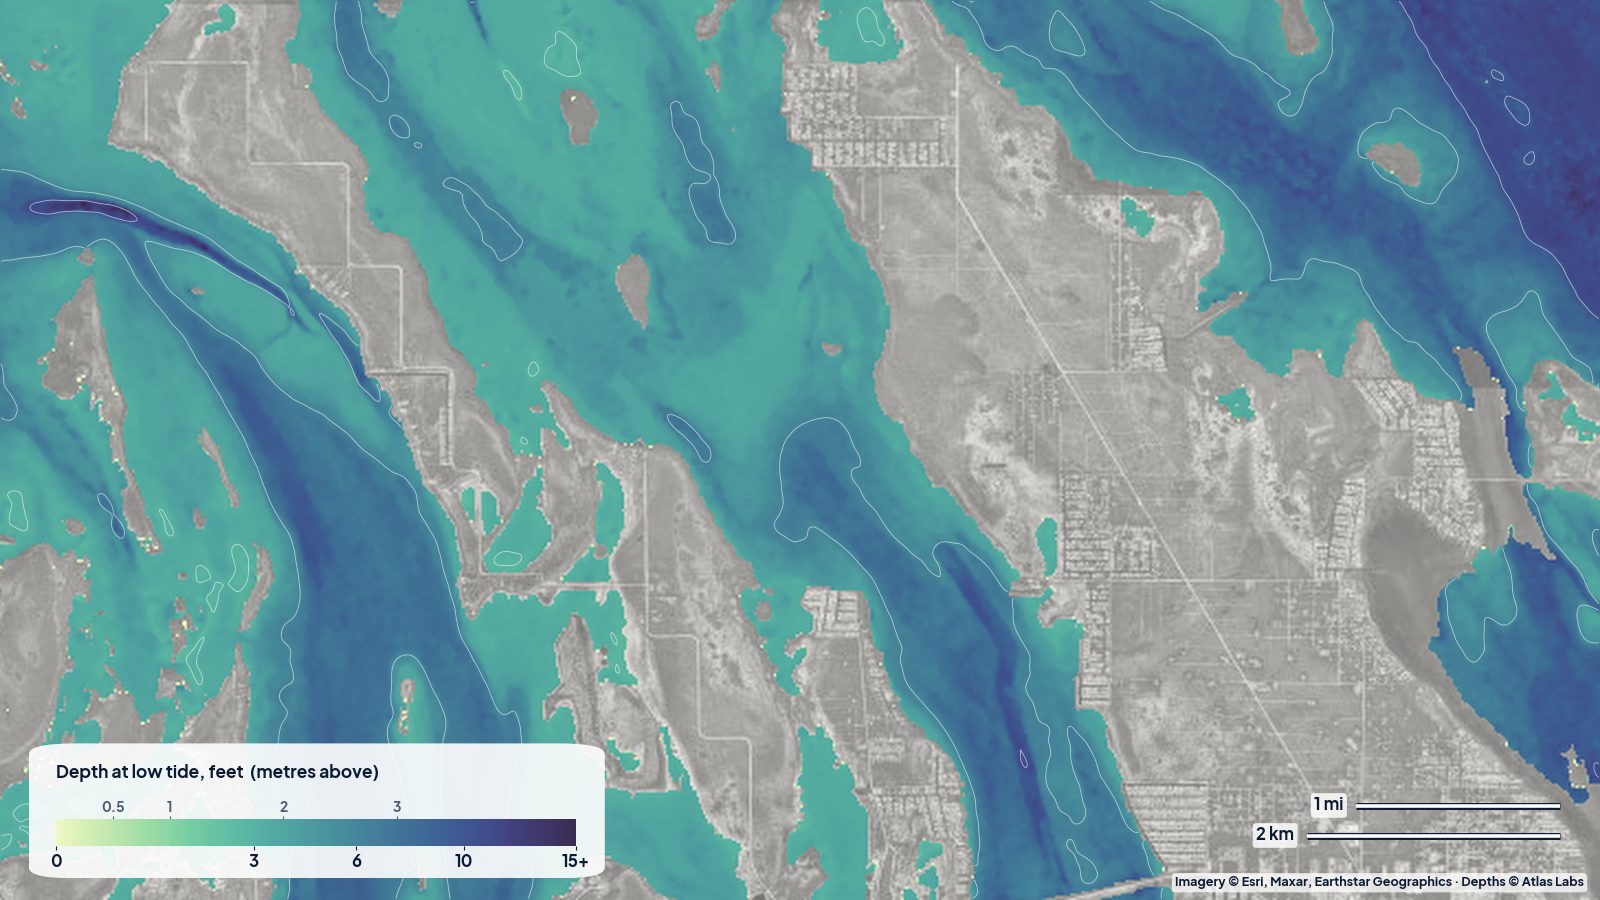
Florida Bay off Flamingo, typical error 3.4 ft (1.04 m). Note the colour scale only runs to 6 ft: the whole bay is shallow, and with a typical error of about 3 ft the map is best read as “where the channels and deeper lakes are”, not as an exact number on every bank.
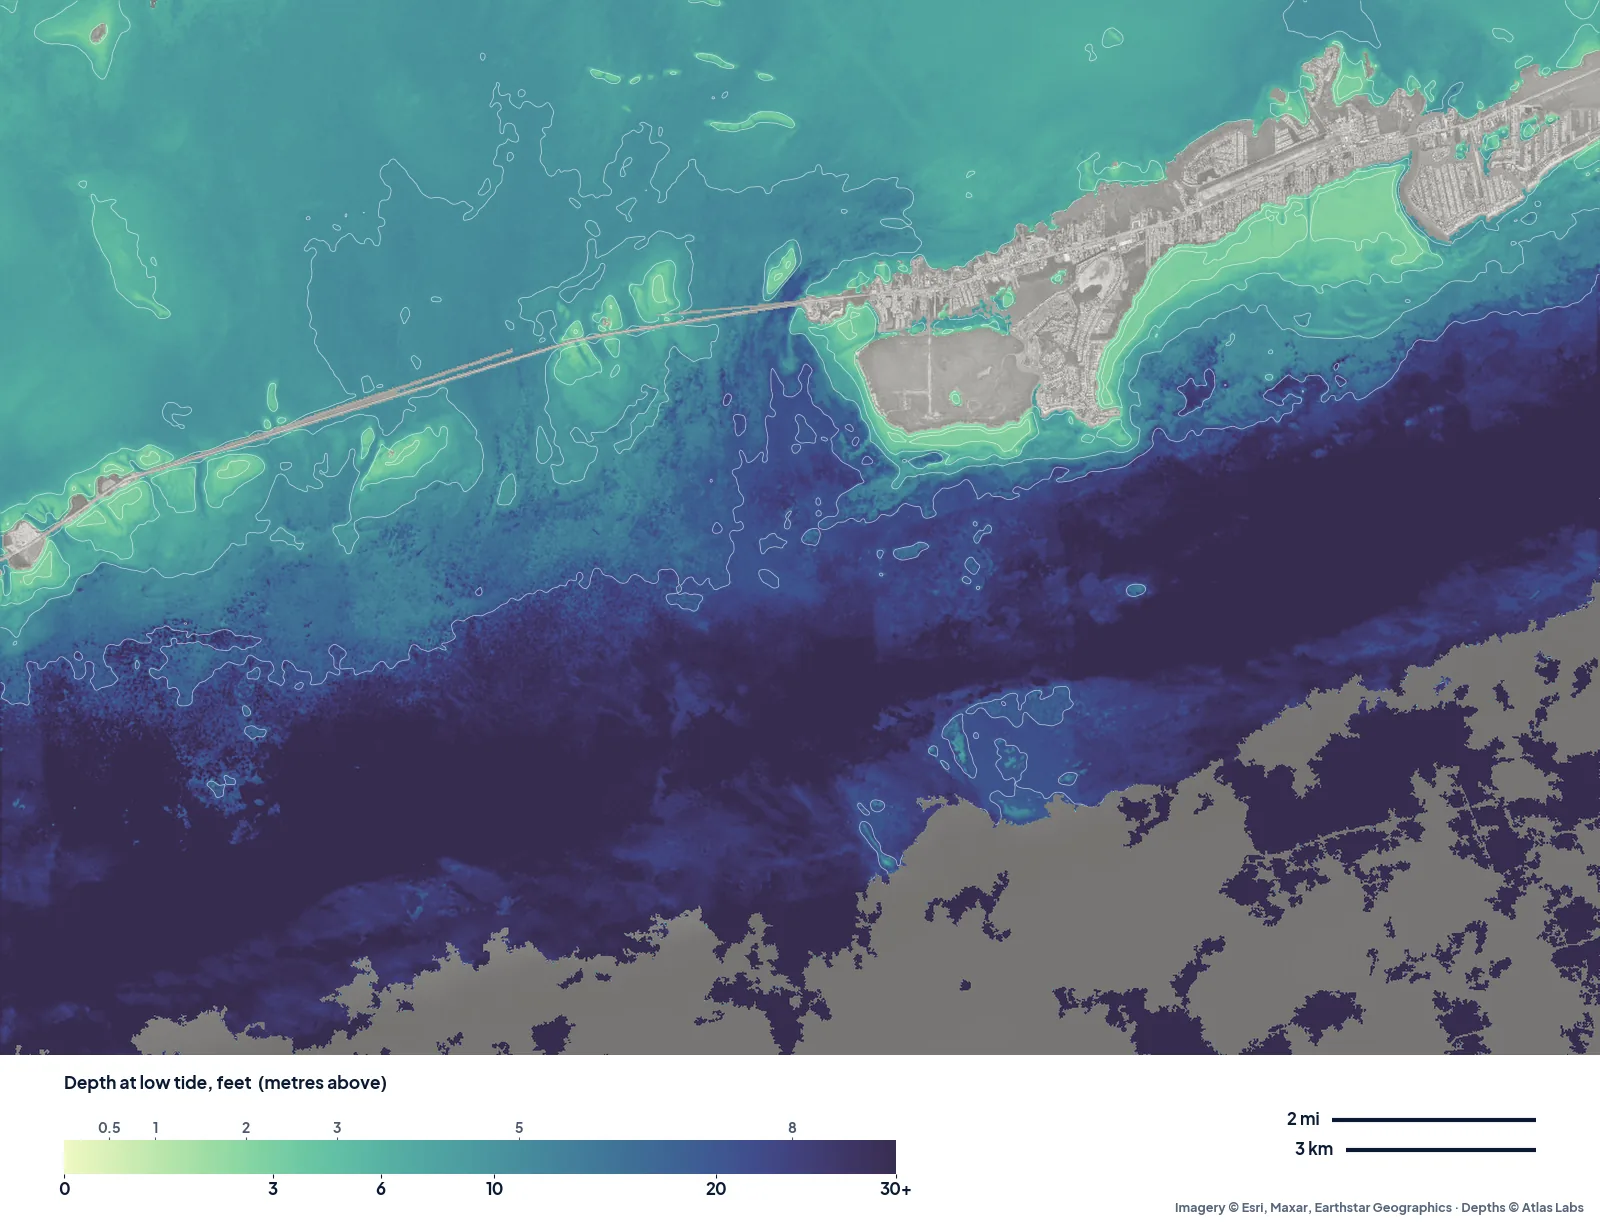
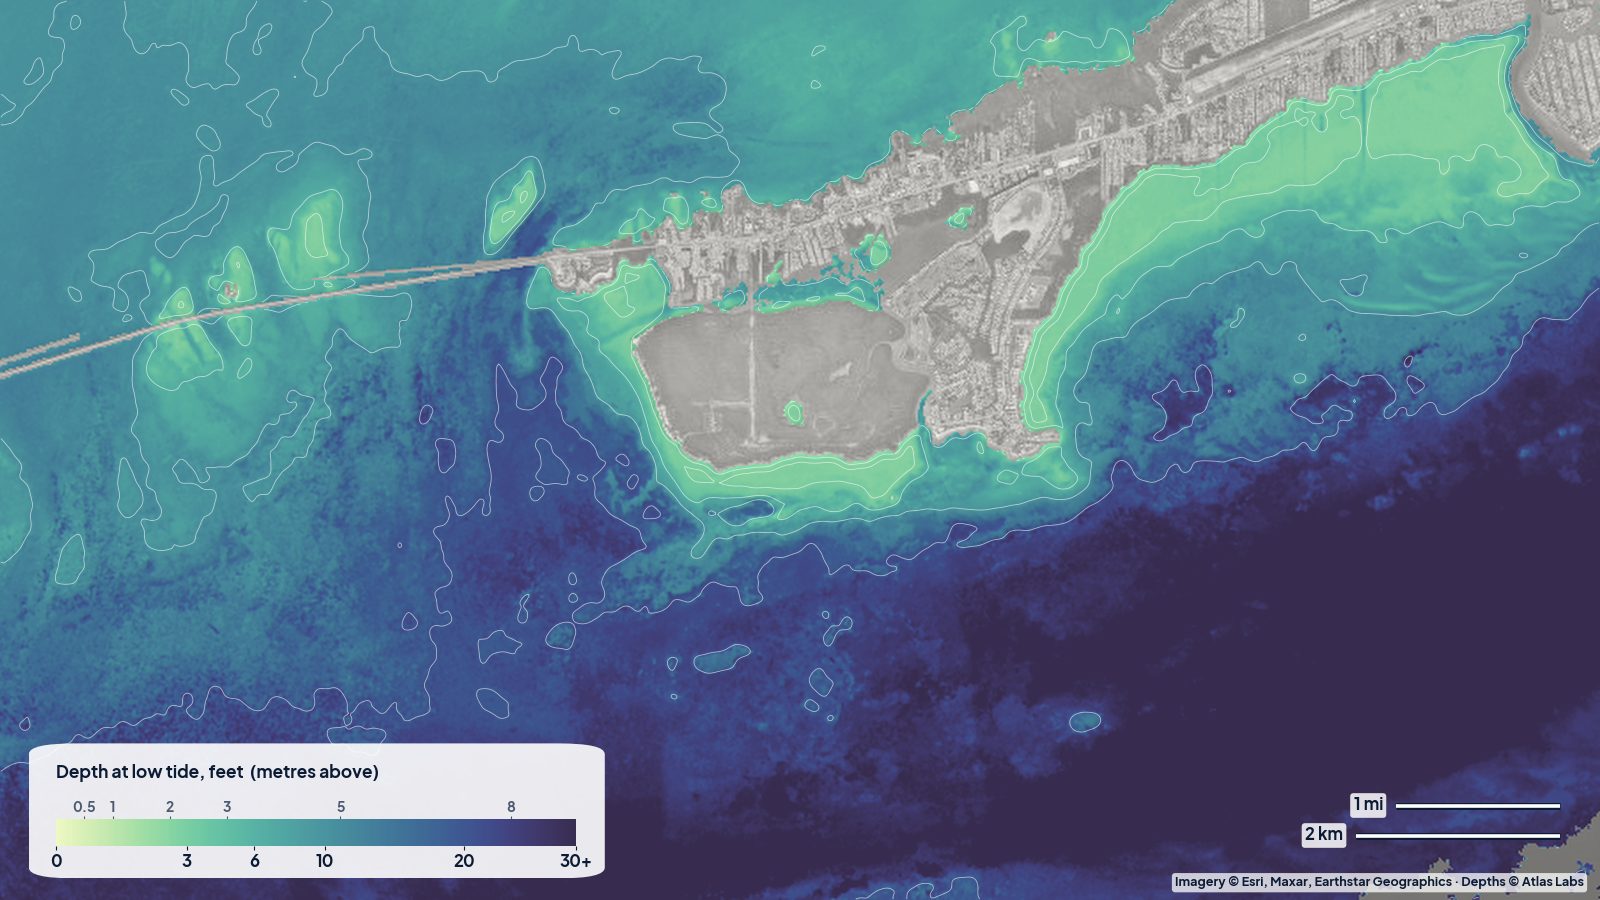
Marathon and the Seven Mile Bridge, typical error 2.9 ft (0.87 m). The Keys sit in between: crisp on the sand and around Boot Key, softer over the dark turtle grass on the bayside.
What we did not publish
We also ran Tampa Bay and two stretches of Florida’s Atlantic coast. In Tampa Bay the typical error came out at 11 to 18 ft, and on the Atlantic coast there were not enough soundings through the surf-churned water to score the map at all. A depth map you cannot trust is worse than none, so those areas stay off the site until we can do better. Every published map clears our quality bar, and its score is printed on the map itself.
What “2 ft typical error” means for you
- On a kayak or paddleboard: plenty. You will see where the sandbars, channels and deep holes are, which is what matters for planning a route or a snorkel stop.
- In a flats skiff drawing 10 to 12 inches: use the map to plan, and your eyes to run. A 2 ft error is the difference between floating and poling off a bank.
- In a keel boat: never use it instead of a chart. It is a planning layer for the places charts do not cover well, not a navigation product.
Depth also changes with the tide. ShoalScope depths are below mean lower low water, the same level as US chart soundings, so at most tides there is more water than the map shows, and on a strong low after a north wind there can be less.
Where next
We are mapping the rest of the Keys, the Exumas, Bimini and the Gulf coast next, and anyone can order a new area and have it computed in about 15 minutes. If you run a marina, a guide service or a coastal project and need the data as GIS files, see depth data for business.
FAQ
Is a satellite depth map as good as a chart?
No. Official charts come from boat surveys and are the legal reference for navigation. Satellite maps cover the shallow water that surveys often skip and are updated more often, but they are estimates with a measured error.
Why does accuracy change from place to place?
Because the method reads the colour of the bottom through the water. Clear water over pale sand gives the strongest signal; murky water, dark seagrass and deep water weaken it.
How deep can it see?
In clear Bahamian water, down to about 60 to 80 ft (20 to 25 m). In the back bays of Florida, often only 10 to 15 ft (3 to 5 m). Beyond that the map is left blank rather than guessed.